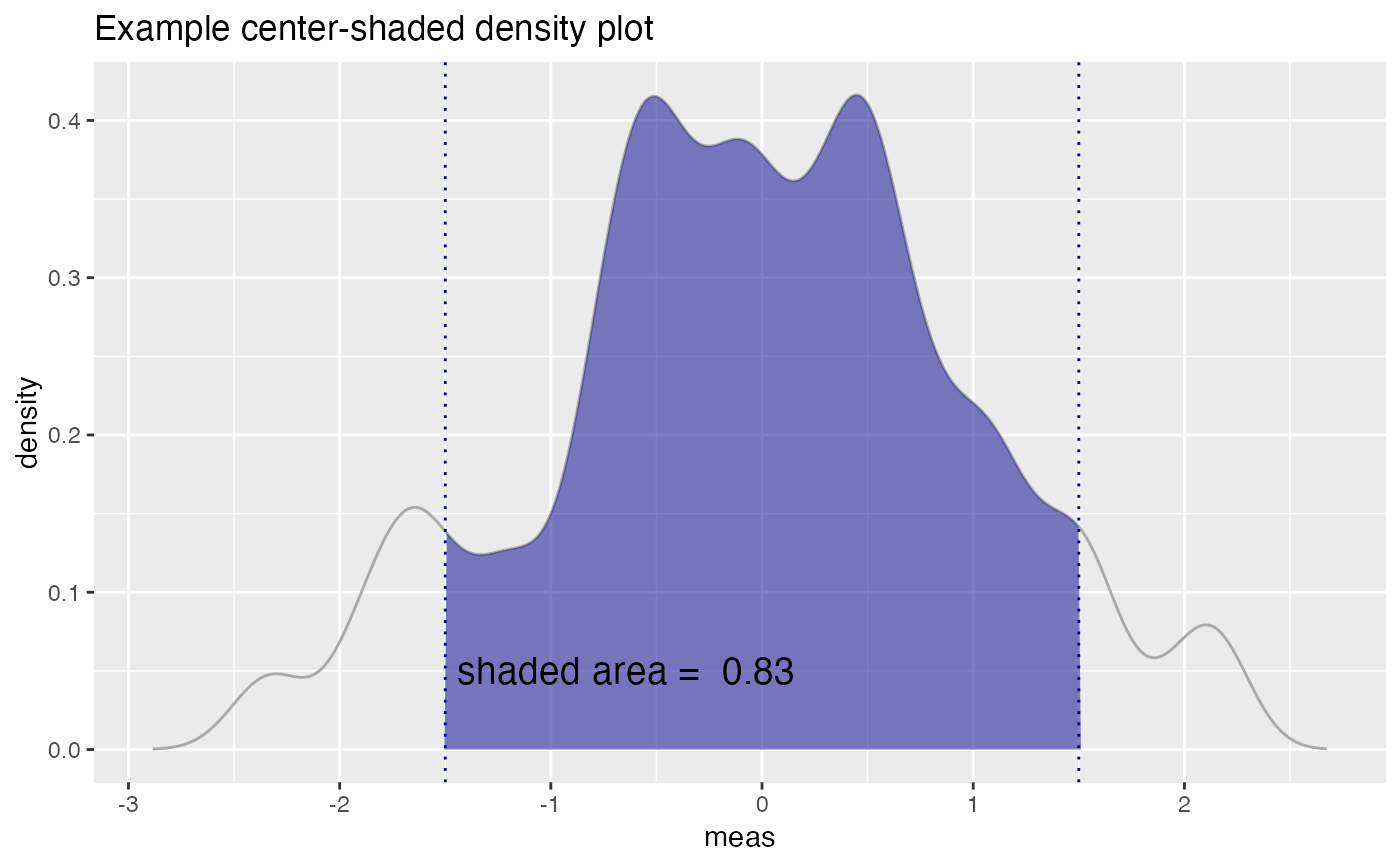
Plot the distribution of a variable with a center region shaded
Source:R/ShadedDensity.R
ShadedDensityCenter.RdPlot the distribution of a variable with a center region shaded. Annotate with the area of the shaded region.
ShadedDensityCenter(
  frame,
  xvar,
  boundaries,
  title,
  ...,
  linecolor = "darkgray",
  shading = "darkblue",
  annotate_area = TRUE
)
Arguments
| frame | data frame to get values from |
|---|---|
| xvar | name of the variable to be density plotted |
| boundaries | vector of the min and max boundaries of the shaded region |
| title | title to place on plot |
| ... | no unnamed argument, added to force named binding of later arguments. |
| linecolor | color of density curve |
| shading | color of shaded region and boundaries |
| annotate_area | if TRUE (default), report the area of the shaded region |
See also
Examples
set.seed(52523)
d = data.frame(meas=rnorm(100))
boundaries = c(-1.5, 1.5)
WVPlots::ShadedDensityCenter(d, "meas", boundaries,
                       title="Example center-shaded density plot")
