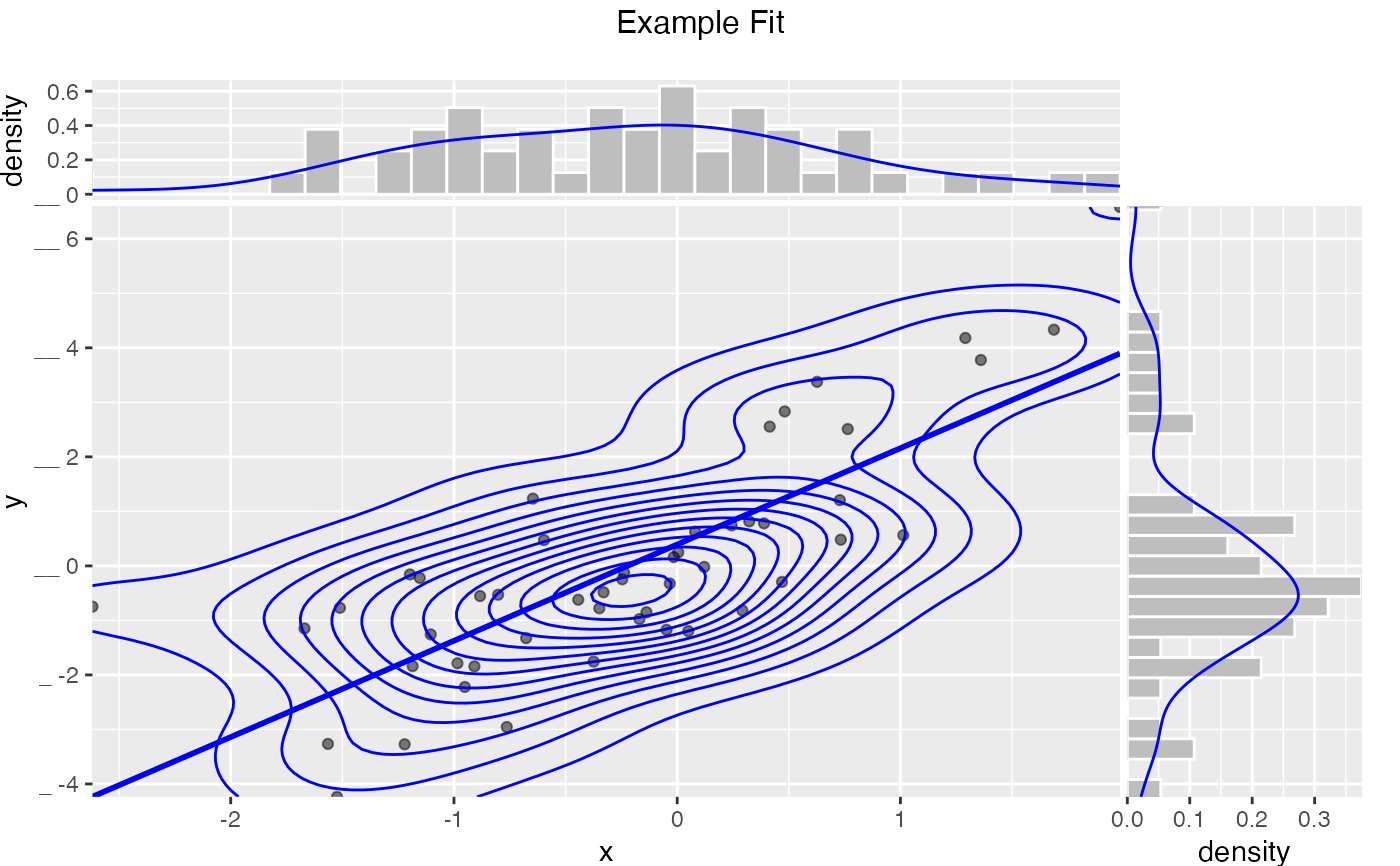
Plot a scatter plot with optional smoothing curves or contour lines, and marginal histogram/density plots.
Based on https://win-vector.com/2015/06/11/wanted-a-perfect-scatterplot-with-marginals/.
See also ggExtra::ggMarginal.
ScatterHist(
  frame,
  xvar,
  yvar,
  title,
  ...,
  smoothmethod = "lm",
  estimate_sig = FALSE,
  minimal_labels = TRUE,
  binwidth_x = NULL,
  binwidth_y = NULL,
  adjust_x = 1,
  adjust_y = 1,
  point_alpha = 0.5,
  contour = FALSE,
  point_color = "black",
  hist_color = "gray",
  smoothing_color = "blue",
  density_color = "blue",
  contour_color = "blue"
)
Arguments
| frame | data frame to get values from |
|---|---|
| xvar | name of the independent (input or model) column in frame |
| yvar | name of the dependent (output or result to be modeled) column in frame |
| title | title to place on plot |
| ... | no unnamed argument, added to force named binding of later arguments. |
| smoothmethod | (optional) one of 'auto', 'loess', 'gam', 'lm', 'identity', or 'none'. |
| estimate_sig | logical if TRUE and smoothmethod is 'identity' or 'lm', report goodness of fit and significance of relation. |
| minimal_labels | logical drop some annotations |
| binwidth_x | numeric binwidth for x histogram |
| binwidth_y | numeric binwidth for y histogram |
| adjust_x | numeric adjust x density plot |
| adjust_y | numeric adjust y density plot |
| point_alpha | numeric opaqueness of the plot points |
| contour | logical if TRUE add a 2d contour plot |
| point_color | color for scatter plots |
| hist_color | fill color for marginal histograms |
| smoothing_color | color for smoothing line |
| density_color | color for marginal density plots |
| contour_color | color for contour plots |
Value
plot grid
Details
If smoothmethod is:
'auto', 'loess' or 'gam': the appropriate smoothing curve is added to the scatterplot.
'lm' (the default): the best fit line is added to the scatterplot.
'identity': the line x = y is added to the scatterplot. This is useful for comparing model predictions to true outcome.
'none': no smoothing line is added to the scatterplot.
If estimate_sig is TRUE and smoothmethod is:
'lm': the R-squared of the linear fit is reported.
'identity': the R-squared of the exact relation between
xvarandyvaris reported.
Note that the identity R-squared is NOT the square of the correlation between xvar and yvar
(which includes an implicit shift and scale). It is the coefficient of determination between xvar and
yvar, and can be negative. See https://en.wikipedia.org/wiki/Coefficient_of_determination for more details.
If xvar is the output of a model to predict yvar, then the identity R-squared, not the lm R-squared,
is the correct measure.
If smoothmethod is neither 'lm' or 'identity' then estimate_sig is ignored.
See also
Examples
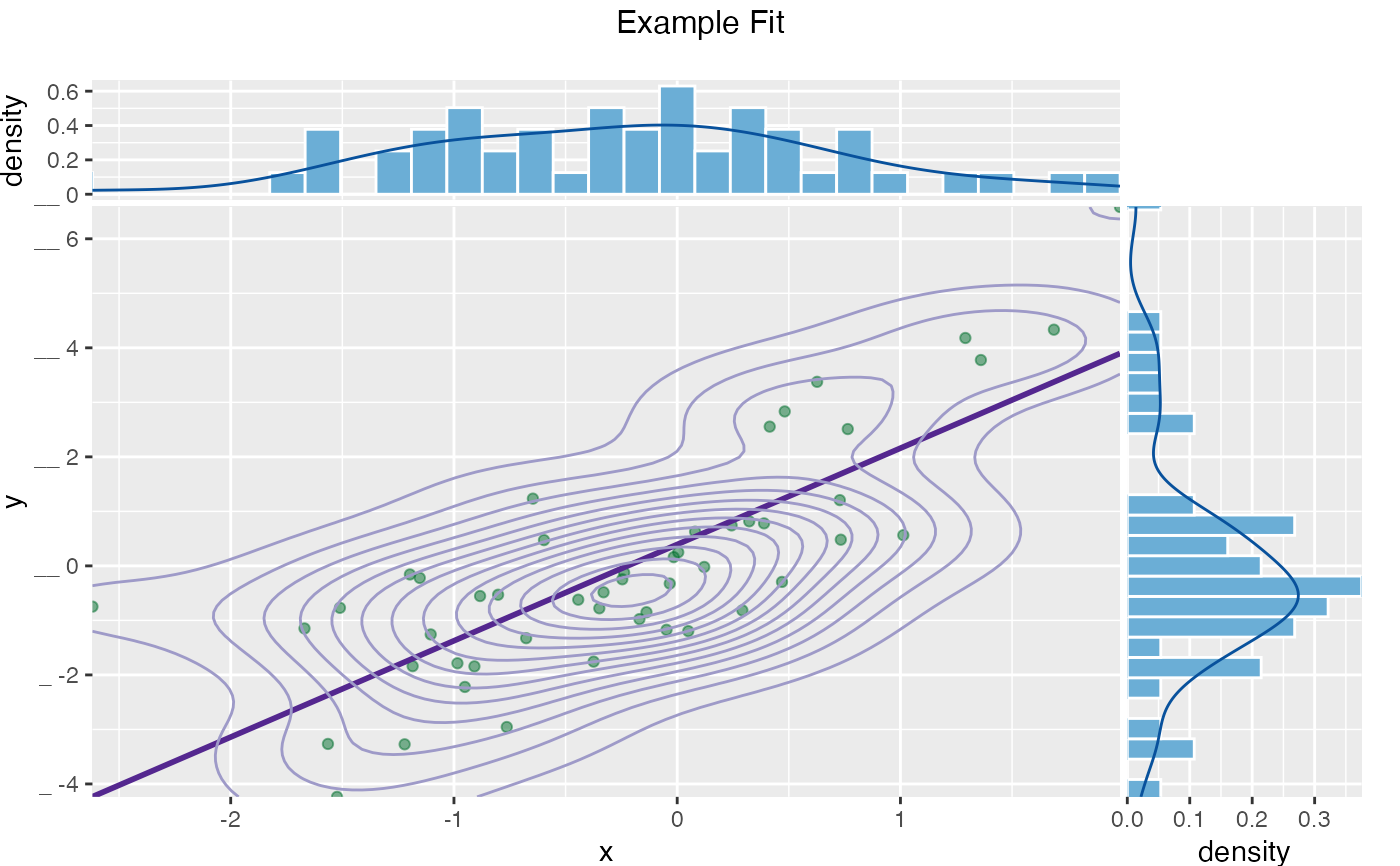
set.seed(34903490) x = rnorm(50) y = 0.5*x^2 + 2*x + rnorm(length(x)) frm = data.frame(x=x,y=y) WVPlots::ScatterHist(frm, "x", "y", title= "Example Fit", smoothmethod = "gam", contour = TRUE)# Same plot with custom colors WVPlots::ScatterHist(frm, "x", "y", title= "Example Fit", smoothmethod = "gam", contour = TRUE, point_color = "#006d2c", # dark green hist_color = "#6baed6", # medium blue smoothing_color = "#54278f", # dark purple density_color = "#08519c", # darker blue contour_color = "#9e9ac8") # lighter purple