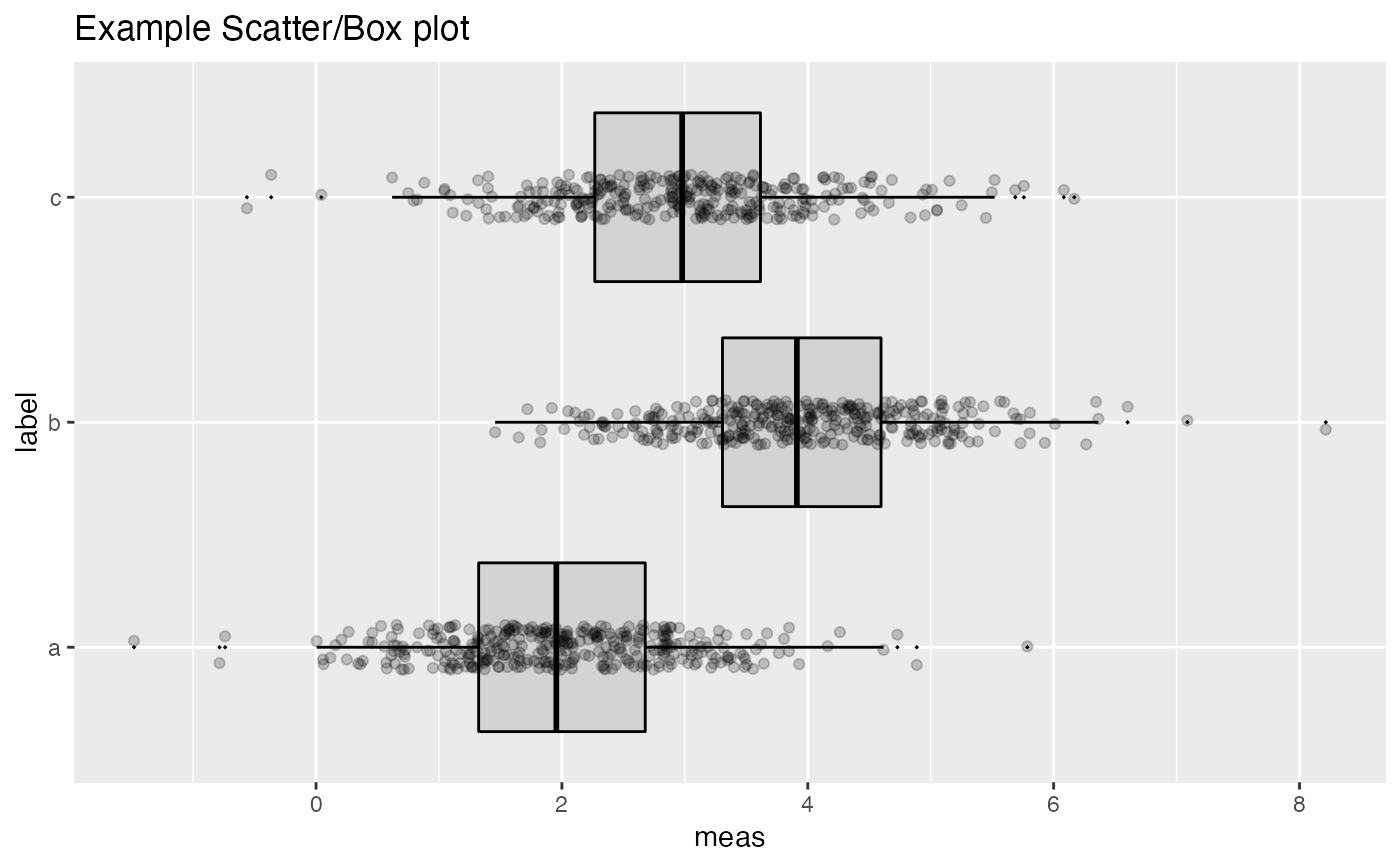
Plot a boxplot with the data points superimposed. Box plots are aligned horizontally.
ScatterBoxPlotH(
  frm,
  xvar,
  yvar,
  title,
  ...,
  pt_alpha = 0.3,
  pt_color = "black",
  box_color = "black",
  box_fill = "lightgray"
)
Arguments
| frm | data frame to get values from |
|---|---|
| xvar | name of the continuous column in frame |
| yvar | name of the independent column in frame; assumed discrete |
| title | plot title |
| ... | (doesn't take additional arguments, used to force later arguments by name) |
| pt_alpha | transparency of points in scatter plot |
| pt_color | point color |
| box_color | boxplot line color |
| box_fill | boxplot fill color (can be NA for no fill) |
Details
xvar is a continuous variable and yvar is a discrete variable.
See also
Examples
classes = c("a", "b", "c")
means = c(2, 4, 3)
names(means) = classes
label = sample(classes, size=1000, replace=TRUE)
meas = means[label] + rnorm(1000)
frm2 = data.frame(label=label,
                  meas = meas)
WVPlots::ScatterBoxPlotH(frm2, "meas", "label",  pt_alpha=0.2, title="Example Scatter/Box plot")