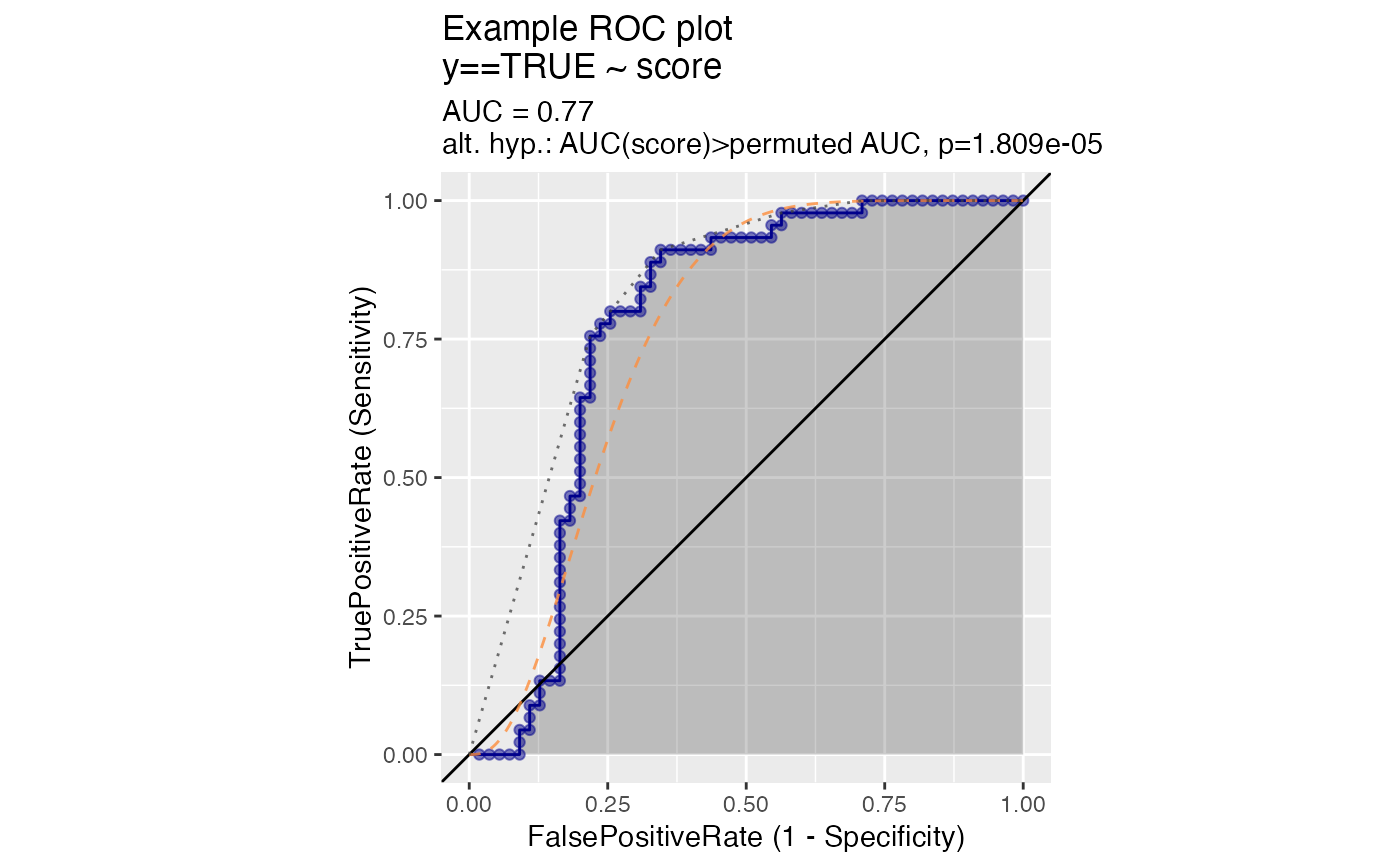
Plot receiver operating characteristic plot.
ROCPlot(
  frame,
  xvar,
  truthVar,
  truthTarget,
  title,
  ...,
  estimate_sig = FALSE,
  returnScores = FALSE,
  nrep = 100,
  parallelCluster = NULL,
  curve_color = "darkblue",
  fill_color = "black",
  diag_color = "black",
  add_beta_ideal_curve = FALSE,
  beta_ideal_curve_color = "#fd8d3c",
  add_beta1_ideal_curve = FALSE,
  beta1_ideal_curve_color = "#f03b20",
  add_symmetric_ideal_curve = FALSE,
  symmetric_ideal_curve_color = "#bd0026",
  add_convex_hull = FALSE,
  convex_hull_color = "#404040",
  ideal_plot_step_size = 0.001
)
Arguments
| frame | data frame to get values from |
|---|---|
| xvar | name of the independent (input or model) column in frame |
| truthVar | name of the dependent (output or result to be modeled) column in frame |
| truthTarget | value we consider to be positive |
| title | title to place on plot |
| ... | no unnamed argument, added to force named binding of later arguments. |
| estimate_sig | logical, if TRUE estimate and display significance of difference from AUC 0.5. |
| returnScores | logical if TRUE return detailed permutedScores |
| nrep | number of permutation repetitions to estimate p values. |
| parallelCluster | (optional) a cluster object created by package parallel or package snow. |
| curve_color | color of the ROC curve |
| fill_color | shading color for the area under the curve |
| diag_color | color for the AUC=0.5 line (x=y) |
| add_beta_ideal_curve | logical, if TRUE add the beta(a, b), beta(c, d) ideal curve found by moment matching. |
| beta_ideal_curve_color | color for ideal curve. |
| add_beta1_ideal_curve | logical, if TRUE add the beta(1, a), beta(b, 2) ideal curve defined in https://journals.sagepub.com/doi/abs/10.1177/0272989X15582210 |
| beta1_ideal_curve_color | color for ideal curve. |
| add_symmetric_ideal_curve | logical, if TRUE add the ideal curve as discussed in https://win-vector.com/2020/09/13/why-working-with-auc-is-more-powerful-than-one-might-think/. |
| symmetric_ideal_curve_color | color for ideal curve. |
| add_convex_hull | logical, if TRUE add convex hull to plot |
| convex_hull_color | color for convex hull curve |
| ideal_plot_step_size | step size used in ideal plots |
Details
See https://www.nature.com/articles/nmeth.3945 for a discussion of true positive and false positive rates, and how the ROC plot relates to the precision/recall plot.
See also
Examples
beta_example <- function(
  n,
  shape1_pos, shape2_pos,
  shape1_neg, shape2_neg) {
  d <- data.frame(
    y = sample(
      c(TRUE, FALSE),
      size = n,
      replace = TRUE),
    score = 0.0
  )
  d$score[d$y] <- rbeta(sum(d$y), shape1 = shape1_pos, shape2 = shape2_pos)
  d$score[!d$y] <- rbeta(sum(!d$y), shape1 = shape1_neg, shape2 = shape2_neg)
  d
}

d1 <- beta_example(
  100,
  shape1_pos = 6,
  shape2_pos = 5,
  shape1_neg = 1,
  shape2_neg = 2)

ROCPlot(
   d1,
   xvar = "score",
   truthVar = "y", truthTarget = TRUE,
   title="Example ROC plot",
   estimate_sig = TRUE,
   add_beta_ideal_curve = TRUE,
   add_convex_hull = TRUE)