Plot distribution of a single discrete numerical variable.
Source:R/DiscreteDistribution.R
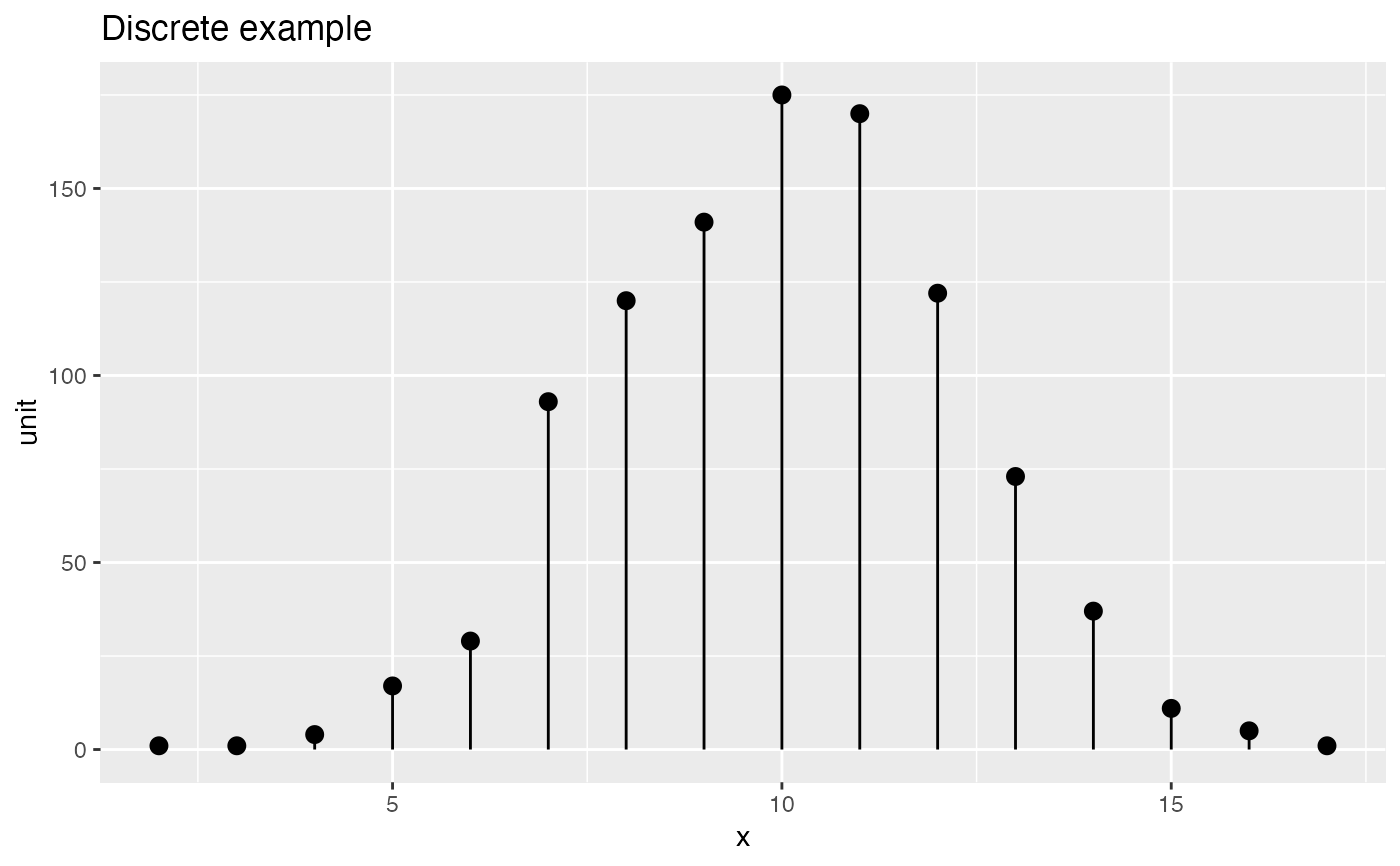
DiscreteDistribution.RdSimilar to calling ClevelandDotPlot with sort = 0 on a numerical x variable that
takes on a discrete set of values.
DiscreteDistribution(frm, xvar, title, ..., stem = TRUE, color = "black")
Arguments
| frm | data frame to get values from |
|---|---|
| xvar | numeric: name of the variable whose distribution is to be plotted |
| title | title to place on plot |
| ... | no unnamed argument, added to force named binding of later arguments. |
| stem | if TRUE add whisker/stems to plot |
| color | color of points and stems |
Examples
frmx = data.frame(x = rbinom(1000, 20, 0.5))
WVPlots::DiscreteDistribution(frmx, "x","Discrete example")